Wind-driven circulation for the eastern North Atlantic Subtropical
Anuncio
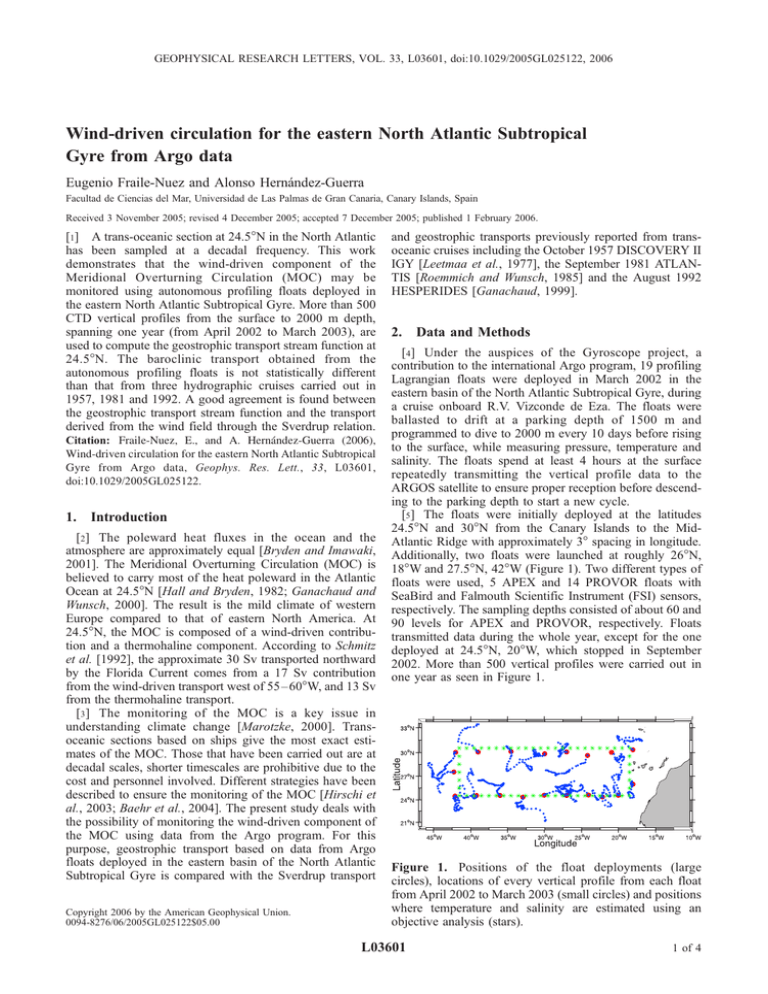
GEOPHYSICAL RESEARCH LETTERS, VOL. 33, L03601, doi:10.1029/2005GL025122, 2006 Wind-driven circulation for the eastern North Atlantic Subtropical Gyre from Argo data Eugenio Fraile-Nuez and Alonso Hernández-Guerra Facultad de Ciencias del Mar, Universidad de Las Palmas de Gran Canaria, Canary Islands, Spain Received 3 November 2005; revised 4 December 2005; accepted 7 December 2005; published 1 February 2006. [1] A trans-oceanic section at 24.5N in the North Atlantic has been sampled at a decadal frequency. This work demonstrates that the wind-driven component of the Meridional Overturning Circulation (MOC) may be monitored using autonomous profiling floats deployed in the eastern North Atlantic Subtropical Gyre. More than 500 CTD vertical profiles from the surface to 2000 m depth, spanning one year (from April 2002 to March 2003), are used to compute the geostrophic transport stream function at 24.5N. The baroclinic transport obtained from the autonomous profiling floats is not statistically different than that from three hydrographic cruises carried out in 1957, 1981 and 1992. A good agreement is found between the geostrophic transport stream function and the transport derived from the wind field through the Sverdrup relation. Citation: Fraile-Nuez, E., and A. Hernández-Guerra (2006), Wind-driven circulation for the eastern North Atlantic Subtropical Gyre from Argo data, Geophys. Res. Lett., 33, L03601, doi:10.1029/2005GL025122. 1. Introduction [2] The poleward heat fluxes in the ocean and the atmosphere are approximately equal [Bryden and Imawaki, 2001]. The Meridional Overturning Circulation (MOC) is believed to carry most of the heat poleward in the Atlantic Ocean at 24.5N [Hall and Bryden, 1982; Ganachaud and Wunsch, 2000]. The result is the mild climate of western Europe compared to that of eastern North America. At 24.5N, the MOC is composed of a wind-driven contribution and a thermohaline component. According to Schmitz et al. [1992], the approximate 30 Sv transported northward by the Florida Current comes from a 17 Sv contribution from the wind-driven transport west of 55– 60W, and 13 Sv from the thermohaline transport. [3] The monitoring of the MOC is a key issue in understanding climate change [Marotzke, 2000]. Transoceanic sections based on ships give the most exact estimates of the MOC. Those that have been carried out are at decadal scales, shorter timescales are prohibitive due to the cost and personnel involved. Different strategies have been described to ensure the monitoring of the MOC [Hirschi et al., 2003; Baehr et al., 2004]. The present study deals with the possibility of monitoring the wind-driven component of the MOC using data from the Argo program. For this purpose, geostrophic transport based on data from Argo floats deployed in the eastern basin of the North Atlantic Subtropical Gyre is compared with the Sverdrup transport Copyright 2006 by the American Geophysical Union. 0094-8276/06/2005GL025122$05.00 and geostrophic transports previously reported from transoceanic cruises including the October 1957 DISCOVERY II IGY [Leetmaa et al., 1977], the September 1981 ATLANTIS [Roemmich and Wunsch, 1985] and the August 1992 HESPERIDES [Ganachaud, 1999]. 2. Data and Methods [4] Under the auspices of the Gyroscope project, a contribution to the international Argo program, 19 profiling Lagrangian floats were deployed in March 2002 in the eastern basin of the North Atlantic Subtropical Gyre, during a cruise onboard R.V. Vizconde de Eza. The floats were ballasted to drift at a parking depth of 1500 m and programmed to dive to 2000 m every 10 days before rising to the surface, while measuring pressure, temperature and salinity. The floats spend at least 4 hours at the surface repeatedly transmitting the vertical profile data to the ARGOS satellite to ensure proper reception before descending to the parking depth to start a new cycle. [5] The floats were initially deployed at the latitudes 24.5N and 30N from the Canary Islands to the MidAtlantic Ridge with approximately 3 spacing in longitude. Additionally, two floats were launched at roughly 26N, 18W and 27.5N, 42W (Figure 1). Two different types of floats were used, 5 APEX and 14 PROVOR floats with SeaBird and Falmouth Scientific Instrument (FSI) sensors, respectively. The sampling depths consisted of about 60 and 90 levels for APEX and PROVOR, respectively. Floats transmitted data during the whole year, except for the one deployed at 24.5N, 20W, which stopped in September 2002. More than 500 vertical profiles were carried out in one year as seen in Figure 1. Figure 1. Positions of the float deployments (large circles), locations of every vertical profile from each float from April 2002 to March 2003 (small circles) and positions where temperature and salinity are estimated using an objective analysis (stars). L03601 1 of 4 L03601 FRAILE-NUEZ AND HERNÁNDEZ-GUERRA: WIND-DRIVEN CIRCULATION L03601 Figure 2. Vertical sections of a) potential temperature and b) salinity as a result of the objective analysis. North, West, South and East stands for each transect, and vertical dashed lines indicate the ends of each transect. Top axis shows each degree in latitude or longitude. [6] The CORIOLIS Data Centre collects, quality controls, validates, formats and distributes the data, which are available through the Global Telecommunications System (GTS). Salinity data from the floats are calibrated using Wong’s method [Wong et al., 2003], which is recommended by the international Argo Science Team. [7] An objective analysis is used to interpolate the irregularly spaced observations to a regularly spaced grid every 1 in latitude and longitude as seen in Figure 1. Each data point is weighted, taking into account its distance from the grid points. The objective analysis used is Successive Corrections, which inverts the array with an iterative process [Pedder, 1993]. Annual climatological temperature and salinity data from WOA94 (World Ocean Atlas, 1994) are used as a first guess [Levitus and Boyer, 1994; Levitus et al., 1994]. The scale factor and the wavelength of the filter are chosen as 0.81 and 5.4 in latitude and longitude as suggested by [Daley, 1991] for large-scale phenomena. [8] Vertical sections of temperature and salinity at every transect are shown in Figure 2. The vertical section of neutral density (gn), which divides the water column into different layers, is shown in Figure 3a. The first four layers (gn 27.38 kg m3, roughly 700 m depth) define the thermocline waters that are affected by North Atlantic Central Water (NACW), characterized by relatively small slope isolines [Harvey, 1982; Emery and Meincke, 1986; Hernández-Guerra et al., 2005]. The shallowest layer at the southwestern region displays the highest salinity (>37.2) due to an excess of evaporation and defines the subtropical high-salinity water. The next three layers (27.38 < gn < 27.922 kg m3, about 700 – 1600 m depth) define the intermediate layer that is affected by two water masses, a fresher (<35.2) Antarctic Intermediate Water (AAIW) layer and a warmer and saltier (>35.3) Mediterranean Water (MW) layer [Worthington, 1976; Käse et al., 1986; Arhan et al., 1994]. Figure 2 shows that the MW and AAIW signatures are stronger in the northeastern and southwestern regions, respectively. [9] The objective analysis allows the estimation of a statistical error for temperature and salinity by comparing the vertical profiles from the Argo data with that obtained Figure 3. a) Neutral density section (see caption of Figure 2 for details). The dashed line corresponding to gn = 27.922 kg m3 is used as a reference layer to integrate the thermal wind equation, and b) integrated mass transport as a function of density layer for the north (circles, solid line), south (stars, dotted line), east (crosses, dashed line), west (diamonds, dashdot line) and the total mass transport from the four transects (heavy, solid line). For each transect, a positive/negative sign indicates northward/ southward or eastward/westward flow. The sign of the net transport is taken as positive/negative for divergent/ convergent flow out/in the box. 2 of 4 L03601 FRAILE-NUEZ AND HERNÁNDEZ-GUERRA: WIND-DRIVEN CIRCULATION Table 1. Statistical Error From the Objective Analysis and Transport Uncertainty From the Monte Carlo Method gn Temperature, C Salinity DG, 109 kg s1 <26.44 26.44 – 26.85 26.85 – 27.162 27.162 – 27.38 27.38 – 27.62 27.62 – 27.82 27.82 – 27.922 >27.922 0.4846 0.2519 0.2033 0.1894 0.1834 0.1036 0.0841 0.0395 0.1007 0.0413 0.0293 0.0277 0.0336 0.0176 0.0148 0.0076 2.1 2.0 1.5 1.1 1.0 0.9 0.4 - from the analysis (Table 1). The largest error is found in the shallowest layer due to the seasonal heating and evaporation. The layer between 27.38 – 27.62 kg m3 presents a relatively high salinity error due to the presence of Mediterranean and Antarctic Intermediate waters. 3. Mass Transport [10] The neutral density interface 27.922 kg m3 is used as the reference level to integrate the thermal wind equation. This level separates the intermediate waters from the deep waters affected by North Atlantic Deep Water (NADW) [Ganachaud, 2003; Hernández-Guerra et al., 2005]. Figure 3b shows the integrated mass transport per layer for each transect and the total mass transport from the four transects. Ekman transport, obtained across each transect from estimates based on QuikScat data for the period April 2002-March 2003, has been added to the shallowest layer. The estimates of Ekman transport are 0.5 Sv, 0.1 Sv, 2.4 Sv and 0.7 Sv for the northern, western, southern and eastern transects, respectively. Positive/Negative sign means northward/southward or eastward/westward flow. This paper uses the unit Sv to indicate both mass transport (1 Sv = 109 kg s1) and volume transport (1 Sv = 106 m3 s1). Figure 3b shows a mainly southward flow. [11] A source of statistical uncertainty in mass transport is related to the statistical error from the objective analysis. A Monte Carlo method is used to estimate this error [Hammersley and Handscomb, 1964]. For each interval of gn, a sample of 2000 values of x (temperature and salinity) L03601 (xi, i = 1, . . ., 2000) are simulated in the range x dx < xi < x + dx, x being the value obtained from the objective analysis for each depth and dx its standard deviation according to Table 1. With these new values, a sample of 2000 mass transports are calculated and used to estimate the statistical uncertainty for each transect and layer. The statistical uncertainty for the net mass transport as seen in Table 1, is introduced as an error bar in Figure 3b. Figure 3b shows that the net mass imbalance is indistinguishable from zero in every layer. [12] Figure 4a shows the net mass transport at the thermocline layer in each transect. The northern transect shows a southward flow at a rate of 9.1 ± 2.0 Sv, presumably due to the different branches into which the Azores Current divides [Stramma, 1984]. Positions of the branches are not possible to identify due to the coarse spatial resolution of the Argo data. The Canary Current is seen in the eastern transect, transporting 2.2 ± 1.0 Sv to the west, south of the Canary Islands. This transport is approximately 1 Sv smaller than that obtained by Machı́n et al. [2006] from an average obtained from four cruises to the north of the Canary Islands. The difference is attributed to a portion of the Canary Current separating from the African coast, south of 24.5N [Hernández-Guerra et al., 2005]. The western transect shows a very weak, and not significantly different from zero, transport of 0.8 ± 1.2 Sv. The southern transect shows a southward transport at a rate of 11.7 ± 2.3 Sv. [13] Assuming that the wind-driven flow does not penetrate to the ocean floor and the vertical velocity is negligible at the lower limit of integration, which Luyten et al. [1983] pointed out as corresponding to sq = 27.4 (approximately gn = 27.38 kg m3), the Sverdrup transport stream function is: 1 br Z Z xw xw Z 0 curl t dx ¼ xe vG dzdx xe H 1 fr Z xw tx dx xe where xe and xw denote the eastern boundary and the western end point of integration, respectively, b = @f/@y ( f is the Coriolis parameter), r density, t the wind stress vector (tx the north-south component) and vG the geostrophic velocity. Figure 4. a) Net mass transport for the thermocline waters at each transect, and b) volume transport for the thermocline waters at 24.5N for 1957 IGY data (blue, dashed line), 1981 data (magenta, dotted line), 1992 data (green, dashdot line) and gyroscope data (red, solid line). The heavy black solid line is the Sverdrup transport computed from mean annual wind stress. 3 of 4 L03601 FRAILE-NUEZ AND HERNÁNDEZ-GUERRA: WIND-DRIVEN CIRCULATION [14] Figure 4b compares the volume geostrophic transport stream function for the thermocline layer at 24.5N with those obtained previously in 1957, 1981 and 1992. The observed volume geostrophic transport from Argo data exhibits a similar pattern to those from 1981 and 1992. Differences are due to the mesoscale eddy field that is smoothed using data spanning one year. The different pattern observed in the integrated geostrophic transport corresponding to 1957, is presumably due to the relatively coarse resolution of the data obtained from this cruise. Figure 4b also shows that the computed geostrophic transport is in good agreement with the estimate from the wind stress (Sverdrup transport minus Ekman transport). [15] This study has demonstrated that the continuous monitoring of change in the wind-driven component of the MOC is possible using data from the Argo program. However, these data are not useful for monitoring changes in the heat flux. According to Vargas-Yáñez et al. [2004], the eastern part of the North Atlantic at 24.5N has warmed at a rate of 0.042C/yr at 400 m depth in the last ten years. This annual warming is much smaller than the statistical uncertainty from the objective analysis (Table 1). [16] Acknowledgments. This study has been funded by the European Commission project Gyroscope (EVK2-CT-2000-00087). The wind field were obtained from the Physical Oceanography Distributed Active Archive Center (PO.DAAC) at the NASA jet Propulsion Laboratory, Pasadena, CA (http://podaac.jpl.nasa.gov). We thank Evan Mason for his help with the English language and two anonymous reviewers for their helpful comments on the manuscript. References Arhan, M., A. Colin de Vèrdiere, and L. Memery (1994), The eastern boundary of the subtropical North Atlantic, J. Phys. Oceanogr., 24, 1295 – 1316. Baehr, J., J. Hirschi, J.-O. Beismann, and J. Marotzke (2004), Monitoring the meridional overturning circulation in the North Atlantic: A modelbased array design study, J. Mar. Res., 62, 283 – 312. Bryden, H., and S. Imawaki (2001), Ocean heat transport, in Ocean Circulation and Climate, edited by G. Siedler, J. Church, and J. Gould, pp. 455 – 474, Elsevier, New York. Daley, R. (1991), Atmospheric Data Analysis, 457 pp., Cambrige Univ. Press, New York. Emery, W., and J. Meincke (1986), Global water masses: Summary and review, Oceanol. Acta, 9, 383 – 391. Ganachaud, A. (1999), Large scale oceanic circulation and fluxes of freshwater, heat, nutrient and oxygen, Ph.D. thesis, Mass. Inst. of Technol./ Woods Hole Oceanogr. Inst. Jt. Program, Cambridge. Ganachaud, A. (2003), Large-scale mass transports, water mass formation, and diffusivities estimated from World Ocean Circulation Experiment (WOCE) hydrographic data, J. Geophys. Res., 108(C7), 3213, doi:10.1029/2002JC001565. L03601 Ganachaud, A., and C. Wunsch (2000), The ocean meridional overturning circulation, mixing, bottom water formation and heat transport, Nature, 408, 453 – 457. Hall, M., and H. Bryden (1982), Direct estimates and mechanisms of ocean heat transport, Deep Sea Res., 29, 339 – 359. Hammersley, J., and D. Handscomb (1964), Monte Carlo Methods, Monographs on Statistics and Applied Probability, 178 pp., CRC Press, Boca Raton, Fla. Harvey, J. (1982), q-S relationships and water masses in the eastern North Atlantic, Deep Sea Res., 29, 1021 – 1033. Hernández-Guerra, A., E. Fraile-Nuez, F. López-Laatzen, A. Martı́nez, G. Parrilla, and P. Vélez-Belchı́ (2005), Canary Current and North Equatorial Current from an inverse box model, J. Geophys. Res., 110, C12019, doi:10.1029/2005JC003032. Hirschi, J., J. Baehr, J. Marotzke, J. Stark, S. Cunningham, and J.-O. Beismann (2003), A monitoring design for the Atlantic meridional overturning circulation, Geophys. Res. Lett., 30(7), 1413, doi:10.1029/ 2002GL016776. Käse, R., J. Price, P. Richardson, and W. Zenk (1986), A quasi-synoptic survey of the thermocline circulation and water mass distribution within the Canary Basin, J. Geophys. Res., 91, 9739 – 9748. Leetmaa, A., P. Niiler, and H. Stommel (1977), Does the Sverdrup relation account for the mid-Atlantic circulation, J. Mar. Res., 35, 1 – 10. Levitus, S., and T. Boyer (1994), World Ocean Atlas 1994, vol. 4, Temperature, NOAA Atlas NESDIS 4, 129 pp., NOAA, Silver Spring, Md. Levitus, S., R. Burgett, and T. Boyer (1994), World Ocean Atlas 1994, vol. 3, Salinity, NOAA Atlas NESDIS 3, 111 pp., NOAA, Silver Spring, Md. Luyten, J., J. Pedlosky, and H. Stommel (1983), The ventilated thermocline, J. Phys. Oceanogr., 13, 292 – 309. Machı́n, F., A. Hernández-Guerra, and J. Pelegrı́ (2006), Mass fluxes in the Canary Basin, Prog. Oceanogr., in press. Marotzke, J. (2000), Abrupt climate change and thermohaline circulation: Mechanisms and predictability, Proc. Natl. Acad. Sci. U. S. A., 97, 1347 – 1350. Pedder, M. (1993), Interpolation and filtering of spatial observations using succesive corrections and Gaussian filters, Mon. Weather Rev., 121, 2889 – 2902. Roemmich, D., and C. Wunsch (1985), Two transatlantic sections: Meridional circulation and heat flux in the subtropical North Atlantic Ocean, Deep Sea Res., 32, 619 – 664. Schmitz, W., D. Thompson, and J. Luyten (1992), The Sverdrup circulation for the Atlantic along 24N, J. Geophys. Res., 97, 7251 – 7256. Stramma, L. (1984), Geostrophic transport in the warm water sphere of the eastern subtropical North Atlantic, J. Mar. Res., 42, 537 – 558. Vargas-Yáñez, M., A. L. G. Parrilla, P. Vélez-Belchı́, and C. González-Pola (2004), Temperature and salinity increase in the eastern North Atlantic along the 24.5N in the last ten years, Geophys. Res. Lett., 31, L06210, doi:10.1029/2003GL019308. Wong, A., G. Hohnson, and W. Owens (2003), Delayed-mode calibration of autonomous CTD profiling float salinity data by q – S climatology, J. Atmos. Oceanic Technol., 20, 308 – 318. Worthington, L. (1976), On the North Atlantic Circulation, 110 pp., Johns Hopkins Univ. Press, Baltimore, Md. E. Fraile-Nuez and A. Hernández-Guerra, Facultad de Ciencias del Mar, Universidad de Las Palmas de Gran Canaria, E-35017 Las Palmas, Spain. ([email protected]; [email protected]) 4 of 4
